Tech
Smartwatches and smartphones used to assess early stages of Parkinson's disease over 12 months in the WATCH-PD study

Study design, setting, and participants
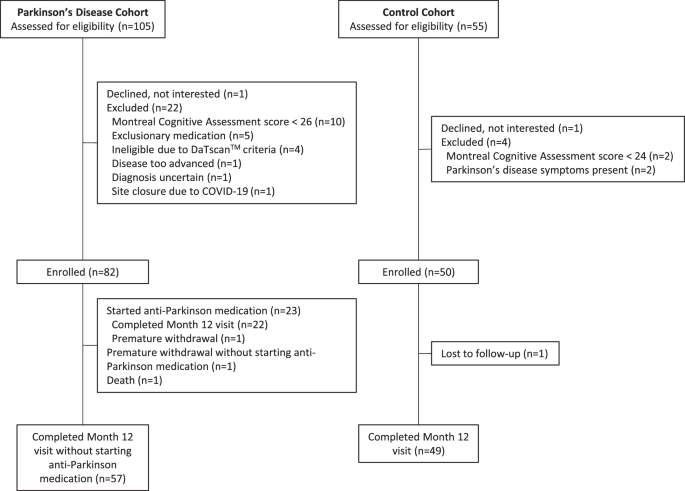
As previously described, WATCH-PD (Wearable Assessment in Clinic and Home of PD, NCT03681015) was a 12-month multicenter observational study that evaluated the ability of digital devices to assess disease characteristics and progression in early-stage, treatment-naive PD8 patients. Participants were recruited from 17 study sites in the Parkinson's Disease Research Group and were assessed in clinic and at home. In-person visits occurred at screening/baseline and at months 1, 3, 6, 9, and 12. Due to the COVID-19 pandemic, most of the visits at month 3 were changed to remote visits via video or telephone, and participants could choose to complete additional visits remotely.
We aimed to evaluate a population similar to the Parkinson's Progression Markers Initiative (PPMI). For PD patients, main inclusion criteria were age ≥30 years at diagnosis, disease duration <2 years, and Hoehn & Yahr stage ≤2. Exclusion criteria included use of dopaminergic or other PD medications at baseline, and alternative Parkinson's disease diagnosis. Control participants without PD or other significant neurological disease were age-matched to the PD cohort.
ethics
The WCGTM Institutional Review Board approved the procedures used in this study and they were in full compliance with human experimentation guidelines. All participants provided written informed consent prior to study participation.
Data Sources/Measurements
As previously described,8 this study used three devices: a research-grade wearable Opal sensor (APDM Wearable Technologies, a subsidiary of Clario), an Apple Watch 4 or 5, and an iPhone 10 or 11 (Apple Inc.) running a PD-specific smartphone application (BrainBaseline). The smartphone application consisted of cognitive, language, and psychomotor tasks, including a trail-making test, a modified symbol-digit modality test, a visuospatial working memory task, speech production, reading, a diadochokinetic speech task, two fine motor tests, and a tremor, gait, and balance task.
During clinic visits, six research-grade wearable sensors with accelerometers, gyroscopes, and magnetometers were worn on the sternum, hips, wrists, and feet. Smartphone application tasks were completed on the smartphone during each clinic visit and every 2 weeks at home. The smartphone was worn in a lumbar sports pouch during gait and balance testing. During each in-person visit, participants wore a smartwatch on their more symptomatic side and tracked symptoms on their smartphone daily for at least 1 week.
Movement data was collected from wearable sensors using Mobility Lab software (APDM Wearable Technologies, a subsidiary of Clario), and measurements were extracted using a custom algorithm written in Python (Wilmington, DE). Gait features were extracted from the smartwatch and smartphone using a modified version of GaitPy41. The algorithm to extract arm swing is a refactored version implemented in Python based on ref. 13. Speech and reading files were processed using custom Python code, with features calculated using the Parselmouth interface to Praat and the Librosa library. Common audio endpoints such as jitter, shimmer, pitch statistics, and Mel-frequency cepstral coefficients (MFCCs) were calculated.
Acceleration data and tremor scores were collected from the smartwatch via Apple’s Movement Disorders Application Programming Interface during the passive monitoring period.42 The Movement Disorders API generated a tremor classification score (none, mild, mild, moderate, strong, unknown) for each minute, and the percentage of time spent in each category was calculated for each participant.2
Clinical measurements
Participants completed conventional assessment scales including the MDS-UPDRS parts I-III, Montreal Cognitive Assessment, Modified Hoehn and Yahr, Geriatric Depression Scale, REM Sleep Behavior Disorder Questionnaire, Epworth Sleepiness Scale, Parkinson's Disease Outcome Scale for Autonomic Symptoms, and Parkinson's Disease Questionnaire-8.
Research scale
The study was powered to detect a 12-month mean change in digital endpoints with good responsiveness to MDS-UPDRS Part III. The mean change from baseline to year 1 in Part III for early untreated PD patients in the PPMI study was 6.9 with a standard deviation of 7.0. Assuming that up to half of participants would initiate dopamine agonist therapy over the 12-month period and 15% would drop out, the study aimed to recruit at least 75 PD patients with 30 participants completing the study without medication. The study had greater than 95% power to detect a true change of 6.9 units using a one-sample t-test with a two-sided 5% significance.
Feature Extraction
Features (e.g., walking, speech) were extracted following the same methodology as described in the baseline paper8, except for the composite measure of walking and speech, which was not previously analyzed. Based on a previous study by Rusz and colleagues34, a composite speech score was formed by normalizing selected individual features using standard cohort statistics at baseline (i.e., subtracting the control baseline mean and dividing by the control baseline standard deviation). This composite was formed using four speech features that differed between individuals with and without PD at baseline8 (log-transformed mean pause duration in the reading task, single-tone pitch features in the reading task, MFCC2 from the speech task, and cepstral peak prominence from the speech task). Walking statistics were obtained using the Forest Oak package implemented in Python43,44. To avoid sleep times, only clock data from 06:00 to 23:59 local time were processed by the Forest Oak package.
Statistical methods
At the start of the study, all PD participants were drug naive and, according to a prespecified analysis plan, all measurements were included up until the time participants started drug treatment. Measurements after starting PD drug treatment were ignored. Statistical analyses were performed in R version 4.2.2. A P value <0.05 was considered statistically significant and no adjustment for multiple comparisons was made.
For longitudinal modeling, we applied mixed-effects modeling to capture individual differences and allow flexible variation in patient progression and time (avoiding strong constraints such as the assumption that progression is linear over time). Statistical analysis was conducted by GAM, performed using the gam function in the mgcv package in the R programming environment45. The GAM framework provided a robust method to measure complex, nonlinear interdependencies between variables. Separate models were fitted for the Parkinson’s disease patient and control cohorts to facilitate understanding the progression of the Parkinson’s disease patient-only cohort for planning future clinical trials.
Relative measures of change from baseline were used as response variables. Once relative measures were calculated, baseline data points were removed to avoid forcing the model to pass through the origin. For predictor variables, the model included baseline and time variable values as fixed effects. The time variable was modeled as a smooth function, i.e., a pchip spline fit with four basis functions, allowing the estimation of a well-defined smooth function46. For random effects, we introduced a random intercept and a random smooth time trajectory for each participant. These terms account for participant-specific variability.
For passive smartwatch data (tremor and step count measurements), measurements were weighted based on the time the watch was worn, with greater weighting on days when the watch was worn longer. Restricted maximum likelihood estimation was used for model fitting. Model selection was performed using the Akaike Information Criterion (AIC) to allow comparison between models. For example, AIC was used to compare models with and without participant-level trajectory fitting, ultimately resulting in the current model.
Test-retest reliability was assessed by comparing the first and second clinic visits, separated by 6 weeks, under the assumption that there had been little progression of Parkinson's disease symptoms during this period.For the home data, we reported three adjacent pairwise comparisons from the first four home measurements (Times 1 and 2, 2 and 3, and 3 and 4).
Not enough data
For the main analyses, participants' data were considered up until they started taking PD medication. Data from early discontinuations were not included. For clinic measurements, each patient had to have provided at least two data points, and for home measurements, each participant had to have at least three data points to be included in the analyses. If a participant had missing data as part of their outcome or any required algorithm, that data point was excluded from that analysis. Zero values (i.e., did not attempt the task) were also excluded. Detailed reasons for missing data are outlined in Supplementary Table 3 of the Baseline Paper 8.
For step count data to be included, participants were considered to have worn the watch for a minimum of 9 hours during their waking hours (6:00 AM – 11:59 PM). This 9-hour threshold was based on publicly available step count data from the PPMI dataset, where steps were collected using Verily Study Watches47. Analysis of the PPMI dataset revealed a Pearson correlation of greater than 0.9 between step counts from at least 9 randomly selected hours within the waking hours (6:00 AM – 11:59 PM) and step counts for the entire waking hours.
Report Overview
Further information about the study design can be found in the Nature Research Reporting Summary linked to this article.
|
Sources 2/ https://www.nature.com/articles/s41531-024-00721-2 The mention sources can contact us to remove/changing this article |
What Are The Main Benefits Of Comparing Car Insurance Quotes Online
LOS ANGELES, CA / ACCESSWIRE / June 24, 2020, / Compare-autoinsurance.Org has launched a new blog post that presents the main benefits of comparing multiple car insurance quotes. For more info and free online quotes, please visit https://compare-autoinsurance.Org/the-advantages-of-comparing-prices-with-car-insurance-quotes-online/ The modern society has numerous technological advantages. One important advantage is the speed at which information is sent and received. With the help of the internet, the shopping habits of many persons have drastically changed. The car insurance industry hasn't remained untouched by these changes. On the internet, drivers can compare insurance prices and find out which sellers have the best offers. View photos The advantages of comparing online car insurance quotes are the following: Online quotes can be obtained from anywhere and at any time. Unlike physical insurance agencies, websites don't have a specific schedule and they are available at any time. Drivers that have busy working schedules, can compare quotes from anywhere and at any time, even at midnight. Multiple choices. Almost all insurance providers, no matter if they are well-known brands or just local insurers, have an online presence. Online quotes will allow policyholders the chance to discover multiple insurance companies and check their prices. Drivers are no longer required to get quotes from just a few known insurance companies. Also, local and regional insurers can provide lower insurance rates for the same services. Accurate insurance estimates. Online quotes can only be accurate if the customers provide accurate and real info about their car models and driving history. Lying about past driving incidents can make the price estimates to be lower, but when dealing with an insurance company lying to them is useless. Usually, insurance companies will do research about a potential customer before granting him coverage. Online quotes can be sorted easily. Although drivers are recommended to not choose a policy just based on its price, drivers can easily sort quotes by insurance price. Using brokerage websites will allow drivers to get quotes from multiple insurers, thus making the comparison faster and easier. For additional info, money-saving tips, and free car insurance quotes, visit https://compare-autoinsurance.Org/ Compare-autoinsurance.Org is an online provider of life, home, health, and auto insurance quotes. This website is unique because it does not simply stick to one kind of insurance provider, but brings the clients the best deals from many different online insurance carriers. In this way, clients have access to offers from multiple carriers all in one place: this website. On this site, customers have access to quotes for insurance plans from various agencies, such as local or nationwide agencies, brand names insurance companies, etc. "Online quotes can easily help drivers obtain better car insurance deals. All they have to do is to complete an online form with accurate and real info, then compare prices", said Russell Rabichev, Marketing Director of Internet Marketing Company. CONTACT: Company Name: Internet Marketing CompanyPerson for contact Name: Gurgu CPhone Number: (818) 359-3898Email: [email protected]: https://compare-autoinsurance.Org/ SOURCE: Compare-autoinsurance.Org View source version on accesswire.Com:https://www.Accesswire.Com/595055/What-Are-The-Main-Benefits-Of-Comparing-Car-Insurance-Quotes-Online View photos

to request, modification Contact us at Here or [email protected]
 |
 |
 |